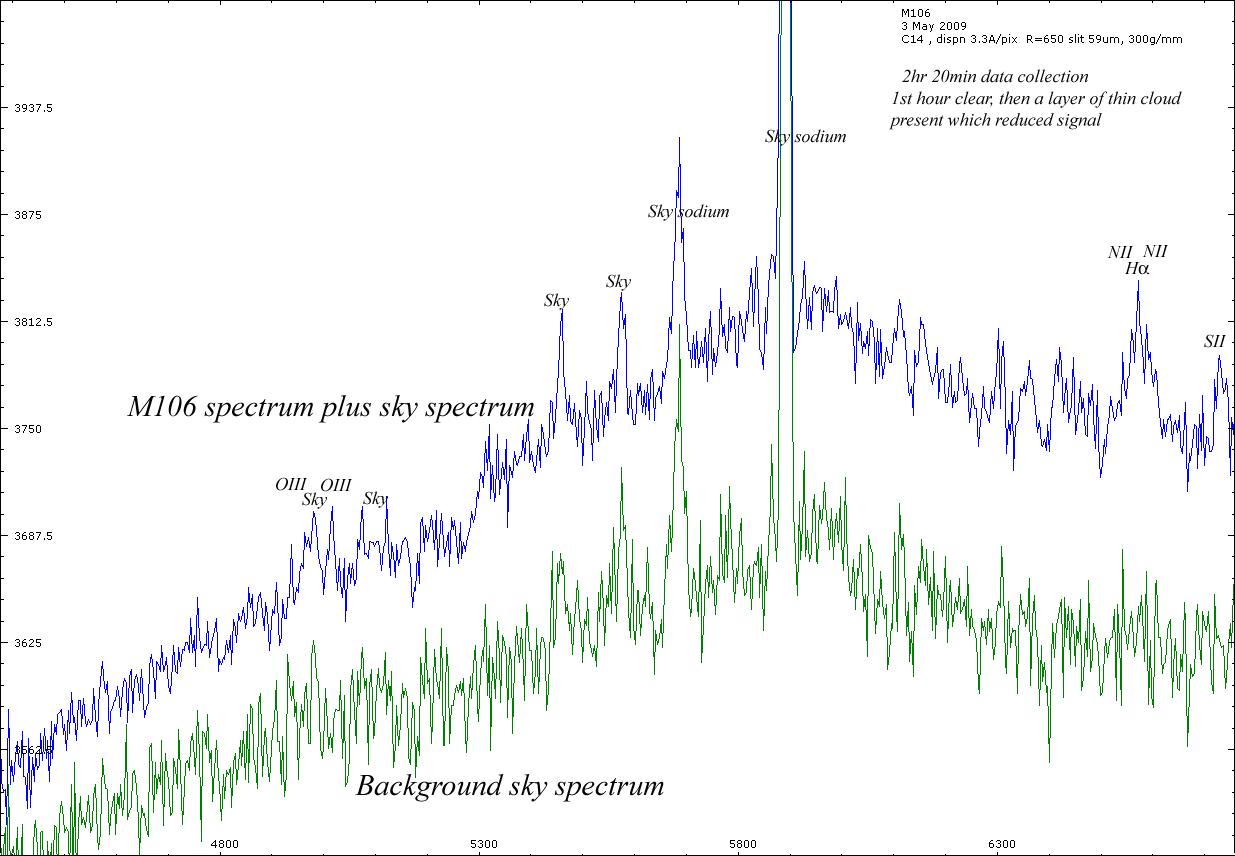
I have been interested in Galaxy structure for a while and decided that I would like to look at them in more detail than I have done so far. Looking through the various pictures that I have taken, M106 looks like a good candidate to test the feasabillity of this concept. It is reasonably bright, is an active galaxy and therefore has interesting emission lines, some of which might be expected to be broad and others thin. The thin lines originate in less dense regions of gas further from the galaxy nucleus and are from forbiden transitions such as OIII which are only seen in the laboratory under low pressure. The range of velocities are lower in these more 'remote' regions, hence the narrower lines. The broad lines are broad because they originate from gas clouds that show a much wider range of velocities, close to the nucleus they will be travelling thousands of kilometers per second. The thin lines do not vary with the brightness of the galaxy core, although the broad lines apparently do. This could be quite an interesting project if it can be done. So, the first question is can I image M106 at low resolution with the Lhires III spectroscope and see any features in the spectrum?
The first step was to take some ordinary images to see what sort of flux I was dealing with. Looking at the images, the maximum pixel values were the same as those for a Magnitude 13 star. Thinking about this, if the light were spread over 200nm, I estimated it would be like trying to image a Mag 18 star under normal circumstances. However, the light is not likely to be totally evenly spread over the spectrum (at least I hoped not!). I concluded that if I could get a significant proportion of the light from the C14 focused on the spectroscope slit, and binned 3x3 on the detector, that I might stand some chance of seeing something, although there would have to be a significant drop in resolution. To get most of the light on the slit I calculated that I should use the C14 at f6.55. The image at the slit should then be about 100um across. I used a slit width of 59um, which with 3x3 should not reduce the resolution much more than the binning does, but clearly allows more light in than the standard 25um slit, but at the cost of decreased resolution. Just to re-itterate, at this stage the aim is to see if anything can be seen, the resolution can be addressed at a later stage if these initial tests are successful. With this set up I felt that I would require at least 90min of exposures to see anything.
The H alpha signal is measured at 6573.866 A. this gives a red shift value of 1.678E-3 (SDSS value is quoted as 1.49E-3)
This measurement gives v = 503 km/s, so if the Hubble constant is taken as 75km/s/Mpc, this puts M106 at 6.7 MPc or 21.8 million light years. (The values given on SEDS is 21 to 25 million light years with a recessional velocity of 537 km/s).
If a heleocentric correction is applied the red shift is adjusted to 1.61E-3.
Looking at this data I suspect that there will not be much difference in the peak width at half height between the OIII and Halpha. What I had failed to check was what type of Seyfert galaxy this is. It is a type 2, which means that the emission lines at best will probably only show broad wings. This data is not good enough to show this. With better data it might be possible to show differences in the line widths, but they will be small. Type 1 Seyferts show the broad emission lines, to see this with a type 2 you have to use a polarising filter (you are then looking at reflected light). The difference between a type 1 and type 2 Seyfert is to do with the angle at which we are viewing the galaxy. With a type 1 we are viewing the central disk flat on, but with a type 2 it is edge on. Seyferts can be graded between type 1 and type 2, which is a result of the viewing angle. At the centre of Seyferts is a black hole with an accretion torus round it. Matter is falling into the black hole releasing radiation as it does so. This radiation then excites the gas clouds round it into emission. Seyfert galaxies are also known as active galaxies, for obvious reasons.
As a first test to see if measurements of this type are possible, this data looks promising, but will require more time under better skies to pursue these measurements further .
Looking at the data, it seems that only the first 35minutes of data were any good, the rest of the frames just added noise. It looks like not only did it become more cloudy, but the spectrum also went out of focus. There was a temperature drop of between 5 and 10degrees, I suspect this is possibly the source of the problem. I will have to check the focus in future....
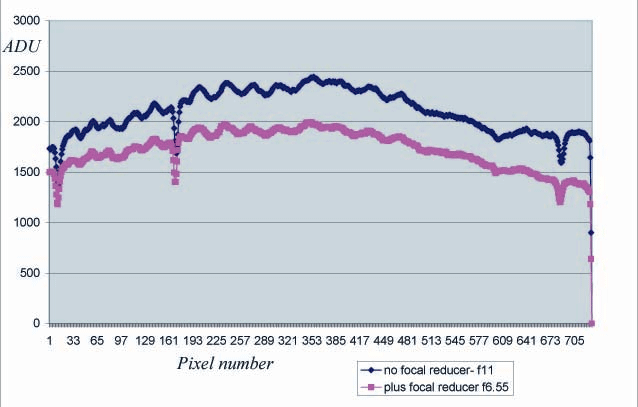
It was also suggested to me that using the telescope at f6.55 was not very sensible, because at this f number there will be significant light loss due to vignetting. I ran a series of test experiments and varified that this was the case. Below is the result which clearly shows that it is better to use the telescope at f11 with the spectroscope, These tests were done on Regulus, which at f6.55 just covered the slit, and at f11 was twice the slit width:
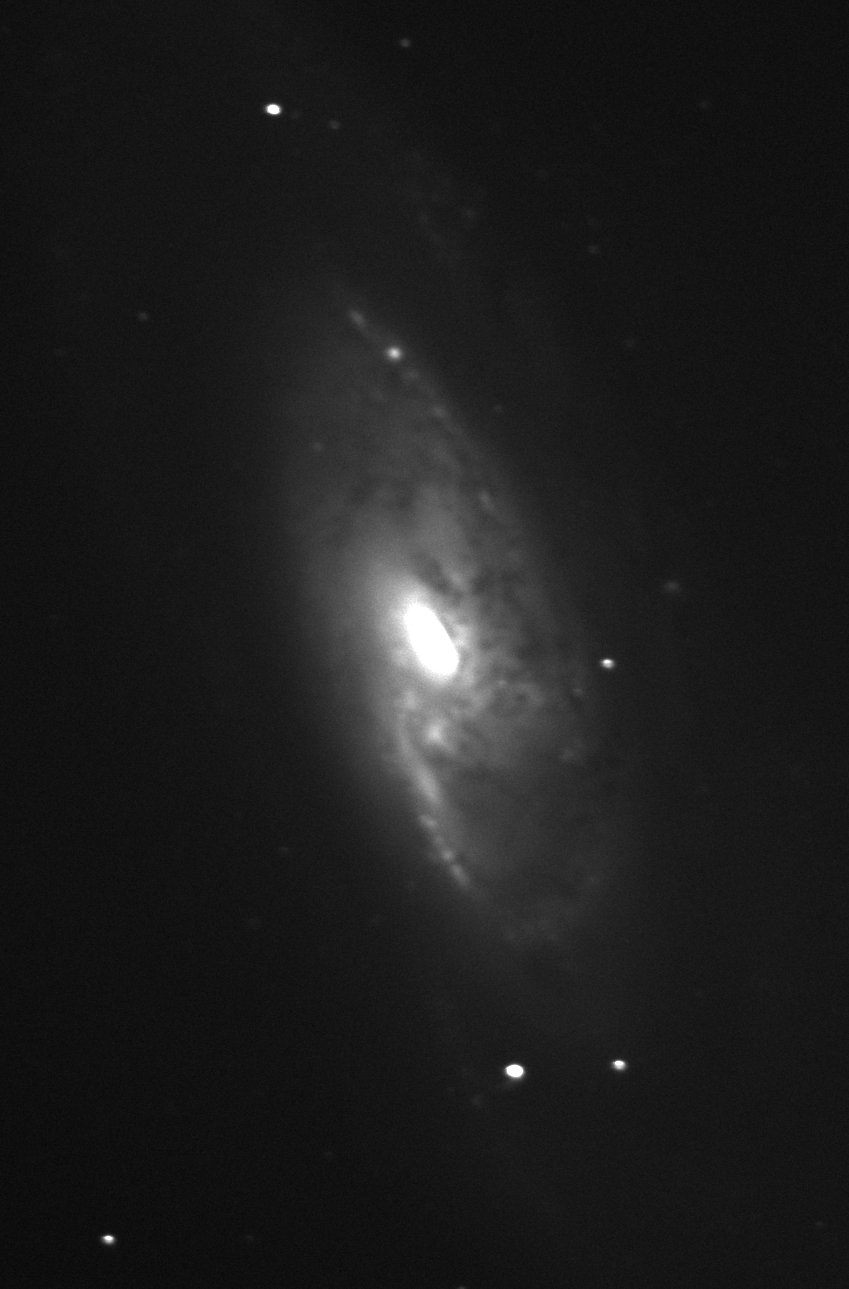
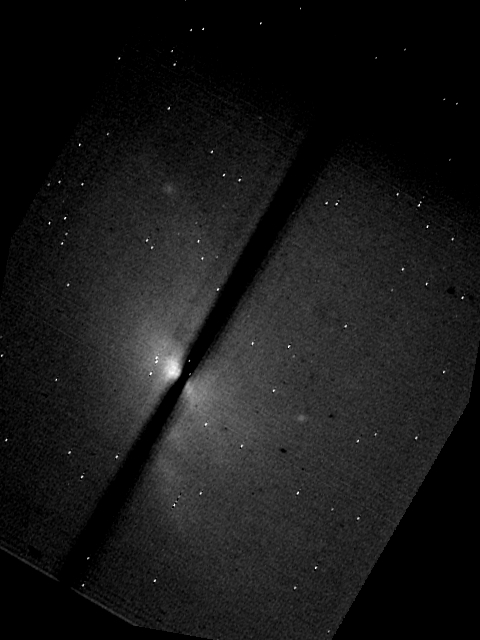
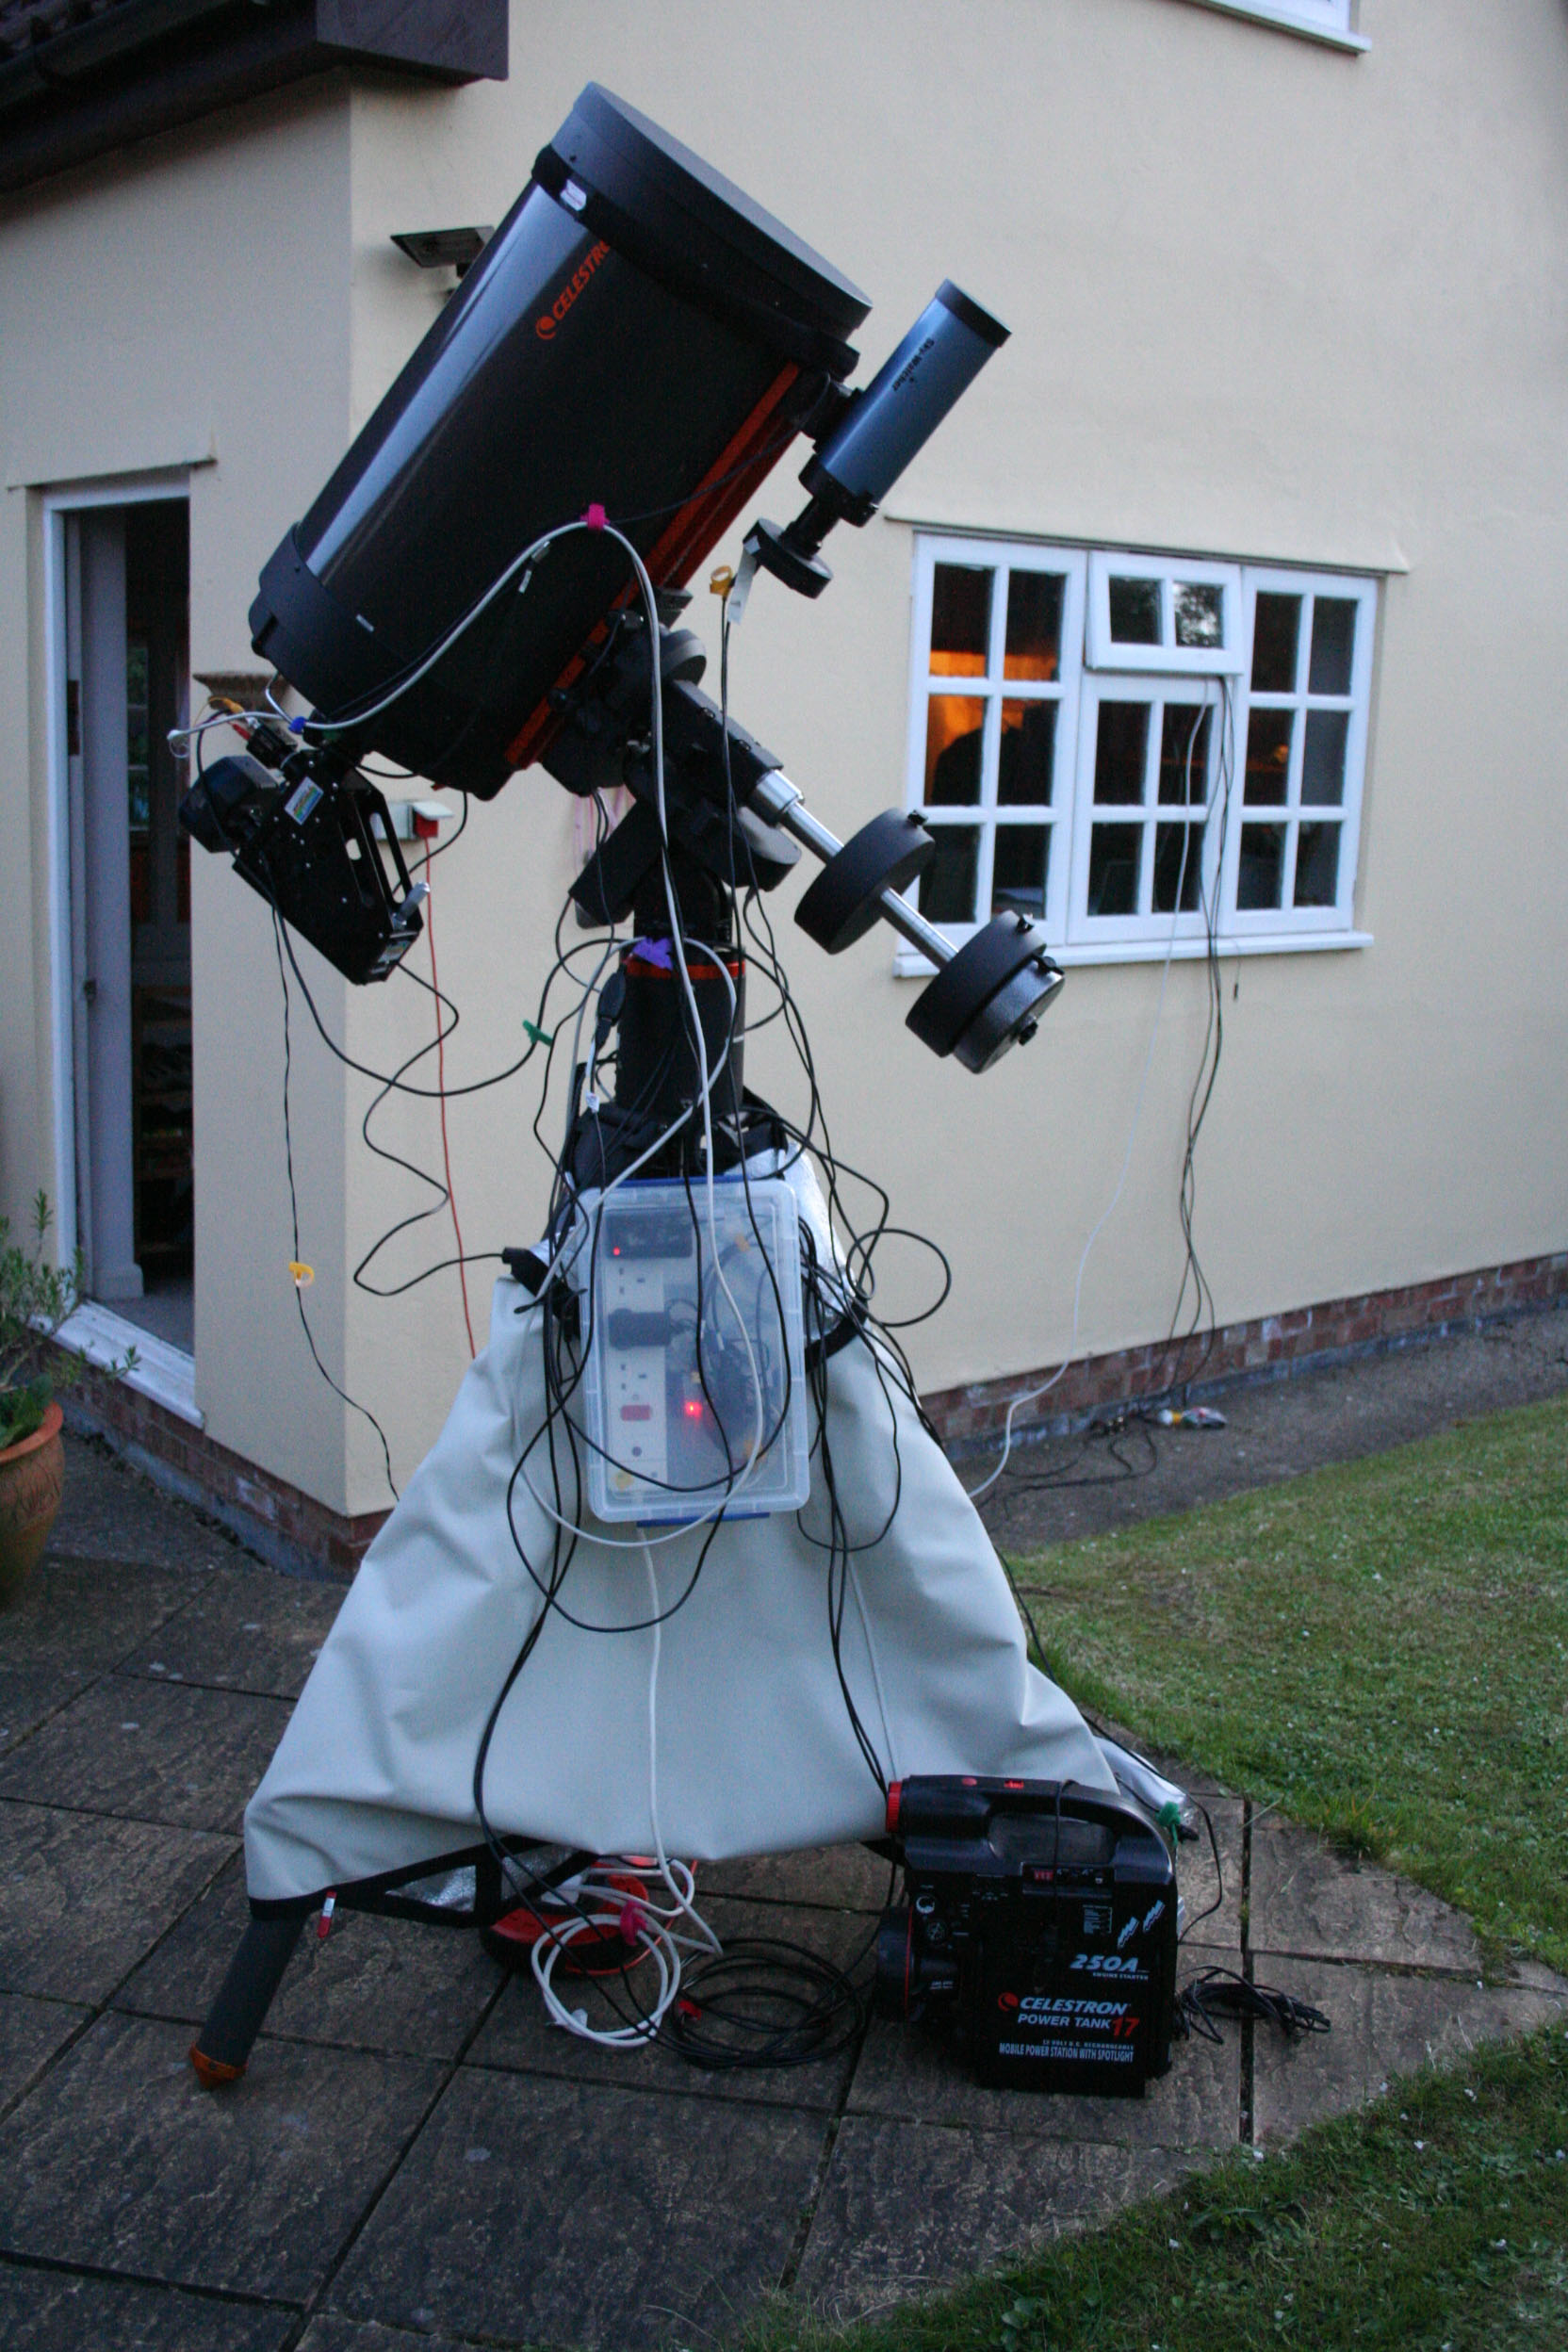
At first the sky was very clear with little wind, but as time passed it became more cloudy until M106 could no longer be seen. The first hour of exposures were under clear skys, however the following 16 exposures (1hr20min) were under gradually poorer conditions. Sky images were take as well as images of M106 so that differences could be verified between background signals and the desired signals. M106 was set on the slit as shown below: